
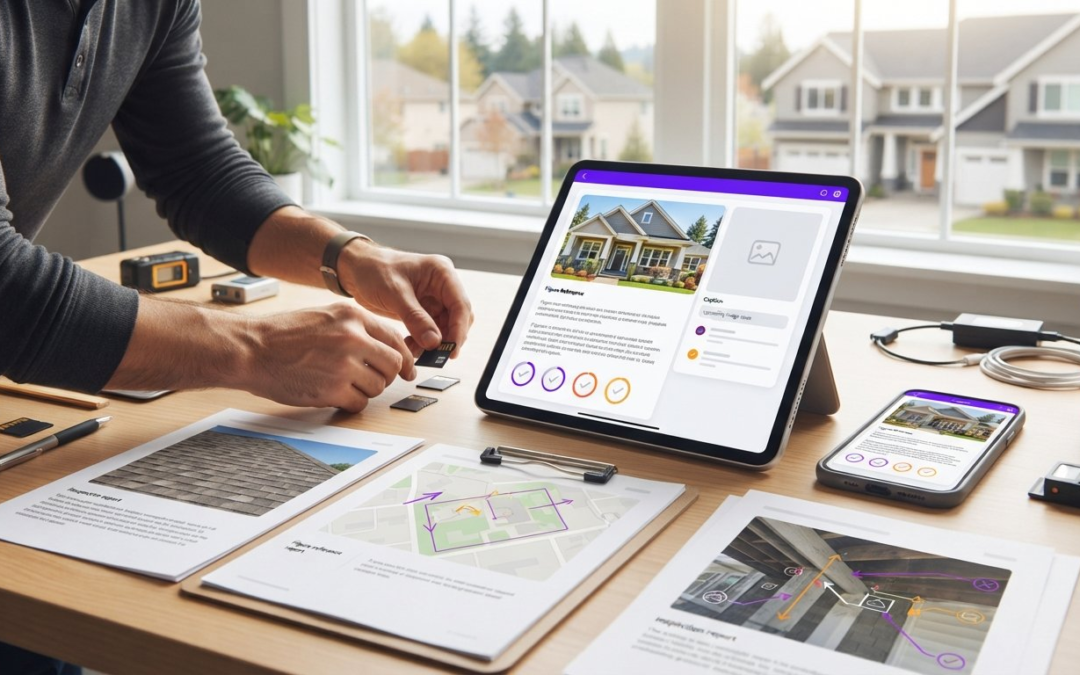
A report’s visuals should appear where readers need them, not disappear into a separate folder. To learn how to embed photos in a report, add a Picture control, then position the image where it supports the text. Photos, illustrations, maps, and graphics can all clarify findings.
Adding visuals is only part of the job. Each image should be easy to understand, accessible, and clearly connected to the surrounding information. This guide explains how to add a Picture control, choose and position media, and use captions and descriptions to give visuals context. Follow these steps to make reports easier to scan, understand, and share.
Key Takeaways
- Add a Picture control to place visual media directly in your report, then size and position it to support the surrounding content.
- Choose photos, illustrations, maps, or graphics based on what best explains the finding, and give each visual clear context.
- Resize and compress images thoughtfully to balance file size with the detail readers need to see.
- Use captions, figure numbers, and citations to help readers identify visuals and understand their source.
- For inspection workflows, PHOTO iD offers automated photo labeling, custom inspection templates, and instant photo report generation.
Adding a Picture control to a report
Use a Picture control to place an image within a report’s layout rather than merely mention it in the text. Add the control in the report’s design view, choose an image, and set its position and display size.
Copyright and permission rules: Use photos you created, images licensed for your intended use, or images you have permission to reproduce. Keep the creator’s details, license terms, and required attribution with the report files.
Troubleshooting missing or blurry images: If an image is missing, reselect the source file and confirm the report can access it. Embedded files travel with the report, while linked files rely on their original location. If an image looks blurry, use a sharper original and avoid enlarging it beyond its available detail.
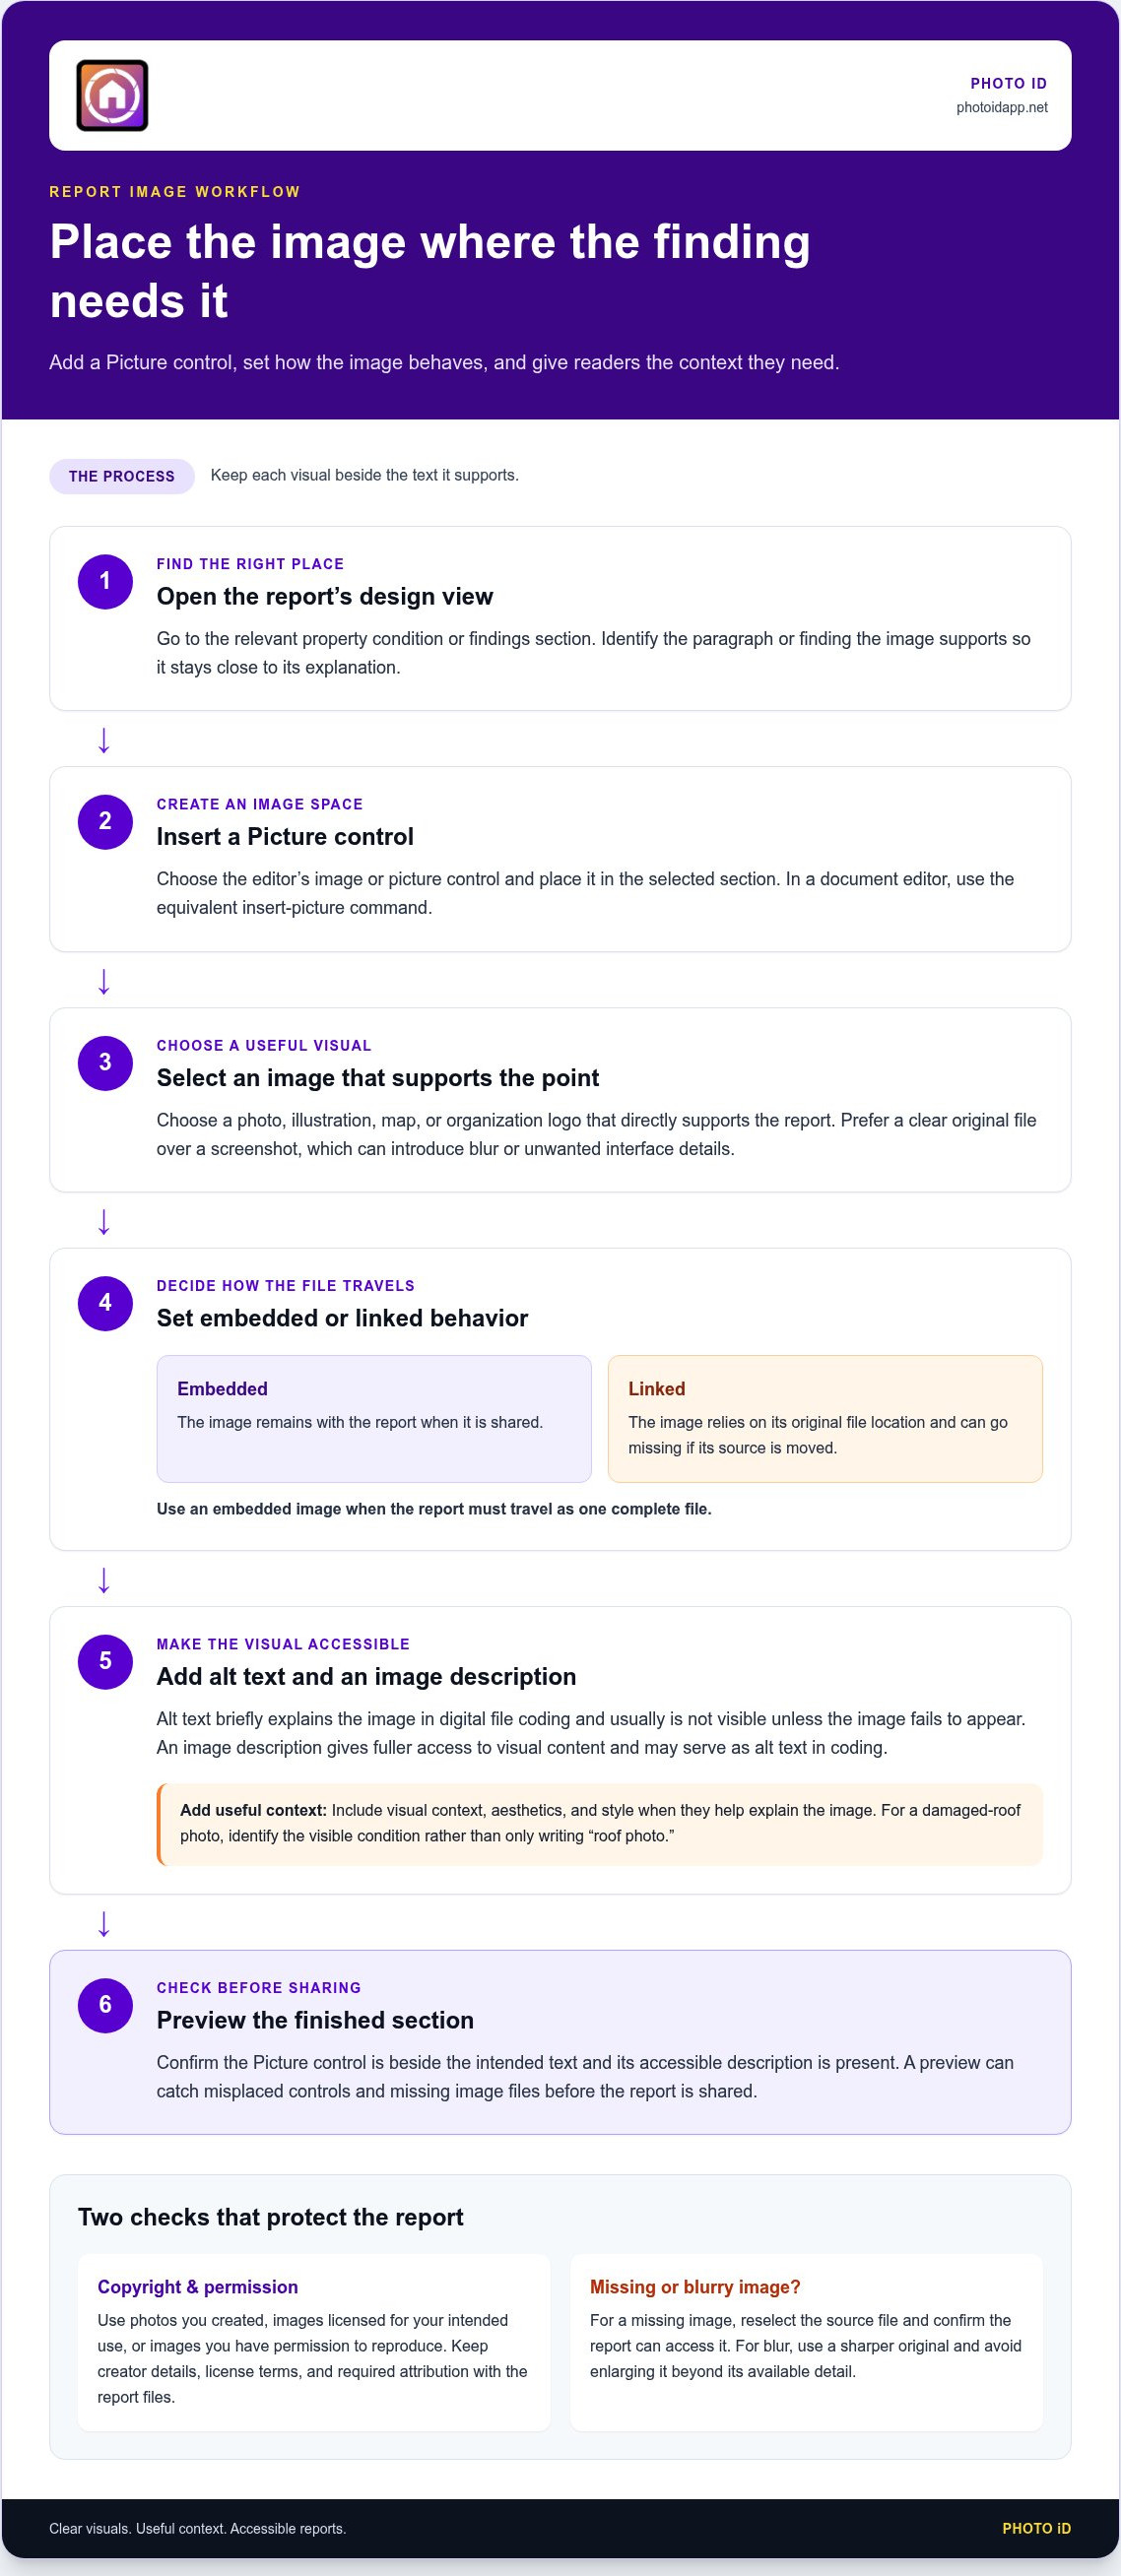
- Open the report’s design view. Go to the section where the visual belongs, such as a property condition or findings section. Identify the paragraph or finding the image supports. This keeps the visual close to its explanation instead of collecting unrelated images at the end.
- Insert a Picture control. Choose the report editor’s image or picture control, then place it in the selected section. In a form-based editor, the control creates a dedicated space for an image. In a document editor, use the equivalent insert-picture command and select a file from your device.
- Select the image source. Choose a photo, illustration, map, or organization logo that directly supports the report’s point. An organization logo may be saved from its website or requested from its marketing team. Prefer a clear original file over a screenshot, which can introduce blur or unwanted interface details.
- Set the image behavior. Choose whether the report stores the image itself or refers to a file location. An embedded image remains with the report when it is shared; a linked image can go missing if its source is moved. Use the embedded option when the report must travel as one complete file.
- Add accessible text. According to the American Anthropological Association, provide both alt text and image descriptions for full accessibility. Alt text briefly explains an image in digital file coding and usually isn’t visible unless the image fails to appear. An image description gives fuller access to visual content and may serve as alt text in coding. Include visual context, aesthetics, and style when they help explain the image.
- Preview the finished section. Check that the Picture control appears beside the intended text and that its accessible description is present. For example, a photo of a damaged roof should identify the visible condition, not merely say “roof photo.” A preview catches misplaced controls and missing image files before you share the report.
Examples for photos, illustrations, maps, and graphics with text
Match each visual to the information it explains, and add the context readers need. These steps help images, captions, and nearby text work together.
- Use photos to document visible conditions. In a property report, place a photo of a cracked tile beside the finding that describes its location and condition. Pair a room-wide view with a close-up when readers need context and detail. Keep each photo focused on one point so the evidence connects clearly to the relevant notes.
- Choose illustrations for processes or components. A labeled roof diagram can show how visible layers relate when a photograph cannot reveal the assembly. Place callouts beside the relevant parts, then explain technical terms in the surrounding text. For graphics with text, check that labels remain readable at the displayed size and don’t rely on color alone.
- Use maps and charts to explain location or patterns. A property-location map can show a building’s position relative to nearby streets or landmarks. Add a clear title and a legend explaining symbols, such as the inspected structure and access points. For a chart, label categories and axes so readers can understand the comparison without guessing.
-
Position images and wrap text
Place each visual beside the paragraph it supports, then choose alignment that preserves reading order. Use text wrapping only when the image is narrow and nearby text remains easy to scan. Preview the entire section for awkward gaps, crowded lines, or text that separates a graphic from its explanation.
- Write alt text for meaningful visuals. Alt text should briefly explain an image’s purpose or key content, such as “Water stain beneath the upstairs window.” According to PHOTO iD accessibility standards, provide both alt text and image descriptions for full accessibility. Descriptions can add context, such as a location’s appearance or an illustration’s style.
-
Add captions, figure numbers, and citations
Add a caption when readers need context beyond the visual, such as the room or condition shown. Captions are optional in most circumstances and don’t replace alt text or image descriptions. Use captions to supplement the image, not repeat its accessibility text.
Number figures in reading order when cross-references help readers find them. Cite the source beside a reproduced map or illustration, following its attribution terms. Keep figure numbering and citation placement consistent throughout the report.
The map example illustrates regional property assessment data across the United States. A clear legend can help readers compare geographic patterns and understand what each category represents.
How to resize and compress photos for a report without losing quality
Resize images to fit their place in the report, then compress copies carefully. Preserve the originals so you can restore detail if an edit looks soft.
- Keep an untouched original. Copy the source photo before editing, and work from the duplicate. For example, retain the full-resolution roof photo while preparing a smaller version for the report page. This protects the evidence and lets you restart if compression creates visible artifacts. Use descriptive filenames so the original and report-ready copy are easy to distinguish.
- Crop to the relevant detail. Remove empty space that doesn’t help explain the finding, but keep enough context to show where the detail appears. A close crop of a cracked tile may clarify its condition; a wider view can show its position in the room. Avoid cropping out landmarks that make the location understandable.
- Resize to the displayed dimensions. Set the photo’s width and height to fit its report column or page area. Shrinking a large image for display can reduce file size, but enlarging a small image can reveal blur and pixelation. Keep the aspect ratio locked while resizing, so a doorway or roofline doesn’t look stretched.
- Choose compression with care. Lossy compression reduces file size by discarding image information, which can soften edges or create blocky patterns. Lossless compression retains the image data but may reduce file size less. For inspection evidence, start with gentle compression and compare details such as shingle edges, fine cracks, and printed labels.
- Match the file format to the visual. Use JPEG for photographs when compact files matter and image detail remains clear. Use PNG for graphics with sharp text, diagrams, or transparent areas. Converting a photo between formats repeatedly can add degradation, so export from the original or a high-quality working copy.
- Check the exported report. Preview the photo at its final on-page size, then zoom in on important details. Review the PDF or other shared file, not just the editor preview. Check that fine features remain distinguishable, colors still represent the scene, and the image hasn’t become unexpectedly blurred after export.
- Balance clarity against report size. If the file is still cumbersome, reduce oversized images individually rather than applying aggressive compression to every photo. A wide room view may tolerate more reduction than a close-up documenting surface damage. Keep the clearest version of critical evidence, and remove duplicate images that add no new information.
How to wrap text around photos and position images in a report
Place each image where readers need it, then set text flow to keep the explanation clear. Use these steps to manage alignment, spacing, and reading order.
- Anchor the image to its related text. Place a photo beside the paragraph describing the same finding, rather than separating evidence from explanation. For example, position a close-up of a cracked window beside the window-condition notes. Anchoring the image to a paragraph can help it move with that content when edits shift the report layout.
- Choose an alignment that fits the page. Center a wide room photo above its description when it needs space to read clearly. Align a smaller image to the left or right when the text column remains comfortable. Keep alignment consistent within the same report section, so readers can scan each finding without adjusting to a new layout.
- Set text wrapping deliberately. Choose a wrap option that lets text flow beside the image only when enough reading space remains. A narrow photo of a fixture may sit beside a short paragraph. A wide exterior image often works better on its own line, because narrow text columns can create awkward breaks.
- Control spacing around the image. Add clear separation between the photo and nearby sentences, captions, or page edges. Without a visible gap, text can appear to touch the image or seem to describe another finding. Preview a paragraph beside a small inspection photo, then adjust padding until both elements remain distinct.
- Keep the reading order predictable. Place the image before or after its related explanation, and preserve that sequence throughout the report. Avoid inserting a photo between a sentence and its continuation. In a screen-based report, confirm the text still reads naturally if the image shifts below the paragraph on a narrower display.
- Prevent layout collisions. Check that wrapped text doesn’t overlap the image, caption, or adjacent table. A photo positioned beside a short list can push its final item into an unexpected column. If the section looks crowded, move the image above the text instead of forcing a tight wrap.
- Review page breaks and final output. Preview the report after editing its text, since changed paragraphs can move anchored images. Keep a photo and its caption together when they explain one condition. Check the exported document too, especially where a page break could leave an image at the bottom and its explanation on the next page.
How to add captions, figure numbers, and citations to report photos
Use captions to add context, figure numbers to support references, and citations to identify image sources. Keep these details separate from accessibility text.
- Decide whether a caption adds useful context. Captions are optional in most circumstances, and they shouldn’t replace alt text or image descriptions. Add one when readers need information beyond what the image shows, such as where a photo was taken or which report finding it supports. For example, “North-facing wall, paint peeling beside the window” adds location and condition.
- Write a concise, specific caption. State the image’s relevance in plain language, rather than repeating a generic label like “Photo of wall.” A caption can explain context without focusing only on visible details. For a map, identify the region or subject; for an illustration, name the component or process it clarifies.
- Number figures in reading order. Assign each figure a number as it appears in the report, then keep that number attached to its caption. If text refers to a visual, use the same figure number in the reference. Update numbering after moving or removing images, so the cross-reference still points to the correct photo.
- Separate captions from image descriptions. Image descriptions are necessary for most visuals, except those included solely for aesthetic or decorative appeal. A caption might say, “Kitchen ceiling after leak repair.” The image description should explain relevant visual content, such as the stain’s location, shape, and contrast against the ceiling.
- Cite visuals you didn’t create. Place attribution near the image or in a source note that readers can connect to it. Include the creator or organization and the source title when available. Follow the source’s stated attribution terms, and keep citations consistent across photographs, maps, and graphics.
- Check every reference after editing. Review captions, figure numbers, and citations together in the final report. If a photo moves below a paragraph, make sure the nearby text still names the correct figure. Confirm that a map citation identifies the source, while its caption explains what the map represents.
- Use a repeatable report workflow. Create a consistent caption and citation pattern for recurring inspection photos, such as location, visible condition, and source. For teams handling many images, explore photo labeling and report generation tools to organize photos alongside report content.
Treat a caption as a small piece of supporting context. It briefly adds information about an image and doesn’t need to describe its visual components. Use it to connect the image with the point readers are considering, rather than narrating every visible detail. Choose context that explains why the image is included, and keep the wording direct enough to scan alongside the photograph.
Before finalizing a caption, consider what readers need to understand the image in the report. The useful context may concern its setting, purpose, or relationship to nearby discussion, rather than the objects shown. Keep the caption focused on that added context so it complements the image instead of competing with it. If the image already communicates the relevant point, don’t add wording just to fill space.
PHOTO iD: PHOTO iD Mobile App Subscription
PHOTO iD’s PHOTO iD Mobile App Subscription supports photo-based inspection reporting. Use Automated Photo Labeling to organize images, then create reports with Instant Photo Report Generation. Custom Inspection Templates help structure report content around recurring inspection needs.
Use these tools when sorting field photos and assembling reports takes too much manual effort. They complement this guide’s practical steps by bringing photo organization and report creation into one inspection workflow.
Visit photoidapp.net to explore PHOTO iD’s reporting tools.
Make Your Next Report Easier to Act On
Build each report around the decision its reader needs to make. Before choosing how to embed photos in a report, consider what recipients should understand or do after viewing each visual. That purpose guides which evidence to highlight and how the report can support follow-up.
A consistent documentation workflow helps teams produce reports that are easier to review across projects. PHOTO iD offers a PHOTO iD Mobile App Subscription, Automated Photo Labeling, and Instant Photo Report Generation for inspection documentation. These tools can help professionals spend less time organizing images and assembling reports.
Choose a workflow that fits your reporting needs, then put it into practice on your next project. Contact PHOTO iD to explore its photo and report tools. Clear visuals, useful context, and a focused next step can make your documentation more effective for every reader. Start with one report, refine your process, and keep moving forward!
Frequently Asked Questions
What kind of media can you add to your reports?
Reports can include photographs, illustrations, maps, charts, and graphics containing text. Choose media that clarifies a finding, shows spatial context, or makes information easier to compare. For example, a floor-plan illustration can orient readers before room-by-room notes, while a chart can show inspection trends. A logo can identify the organization. Keep decorative visuals secondary so they don’t distract from evidence or essential report details.
How do you add images to a PDF report?
If you’re learning how to embed photos in a report, add images to the source document before exporting it as a PDF whenever possible. This helps preserve their placement during conversion. For an existing PDF, use an editor to insert and position the image, then save a revised copy. Reopen the saved file and check that the image appears beside the intended text before sharing it.
How do you embed images in a report so they display on other computers?
A reliable way to embed photos in a report is to store each image inside the report file rather than link to a local folder or temporary location. Copy the finished report to another device and open it there. Confirm the images display without access to your original computer or working folders. This portability test can catch missing media before recipients rely on the report.
What image file formats and resolutions work best in reports?
JPEG generally suits photographs, while PNG works well for graphics with crisp labels or transparent backgrounds. Choose a format accepted by your report editor and supported in the exported file. No single resolution suits every report: match image detail to its display size and purpose. Check fine features, such as small labels or surface damage, at the size readers will view them.